Unravelling TRON (TRX) Price Dynamics: Anticipating Volatility Fluctuations?
TRON (TRX) has recently sparked considerable intrigue among traders, hinting at a potential surge in market volatility. Despite a recent downtrend, the 7-Day Relative Strength Index (RSI) remains perched in the overbought territory, signalling sustained market enthusiasm.
An intriguing development unfolds as the long-term Exponential Moving Average (EMA) converges with its short-term counterpart, portending significant shifts in market sentiment. For a deeper understanding, delve into the detailed analysis below.
Assessing TRON’s RSI: A Balancing Act
In the twilight days of February, TRON’s 7-day Relative Strength Index (RSI) soared to a staggering 91, marking an excessively overbought scenario. Since then, the RSI has seen a substantial pullback, settling at 71. Despite this retreat, an RSI value above 70 signals lingering overbought conditions.
This suggests a potential course correction for TRX, as traders mull over the notion of overvaluation at current levels, potentially prompting profit-taking activities.
As a momentum oscillator, the RSI oscillates between zero and 100, serving as a gauge for overbought or oversold market conditions. Typically, an asset is deemed overbought when the RSI exceeds 70, hinting at potential overvaluation.
Given the persistent RSI levels above 70, the likelihood of a corrective pullback looms large, as investors weigh the option of capitalizing on gains, thereby exerting downward pressure on prices.
Emergence of TRX Traders: A Notable Shift
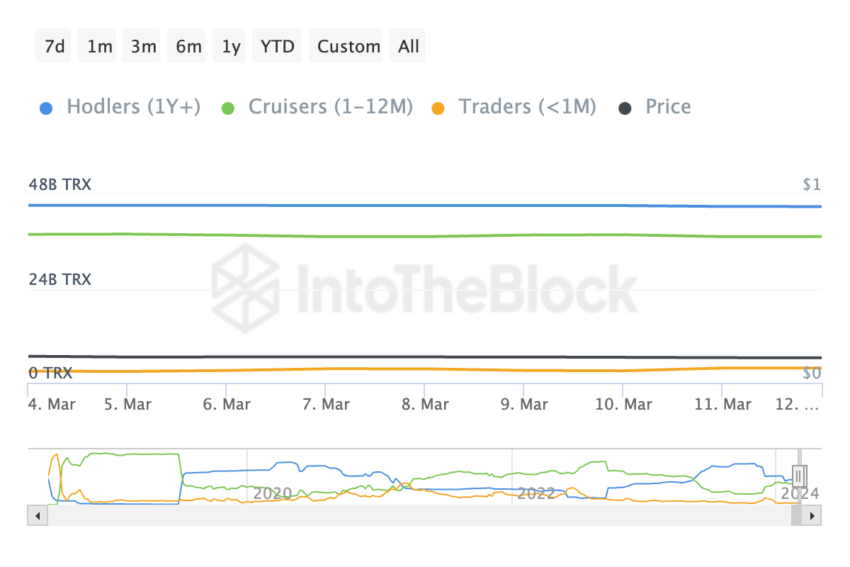
A closer examination of the TRON (TRX) Balance by Time Held reveals fascinating insights into TRX distribution across different holder categories:
- Hodlers, steadfastly holding coins for over a year
- Cruisers, maintaining holdings between one month and twelve months
- Traders, engaging in short-term positions for less than a month
Noteworthy is the significant surge in TRX supply held by Traders in recent times, with their TRX holdings swelling from 2.95 billion to 3.73 billion. This surge, amounting to a 26.44% increase, underscores the growing influence of short-term traders in the circulating supply.

This surge in TRX held by traders typically signals an imminent uptick in price volatility. Short-term traders are more responsive to market shifts, often reacting swiftly to recent trends and events, thereby amplifying price swings.
Consequently, such a notable surge in TRX held by traders may exert multifaceted impacts on price dynamics. Should these traders decide to liquidate their holdings, it could flood the market with additional supply, driving prices southward.


