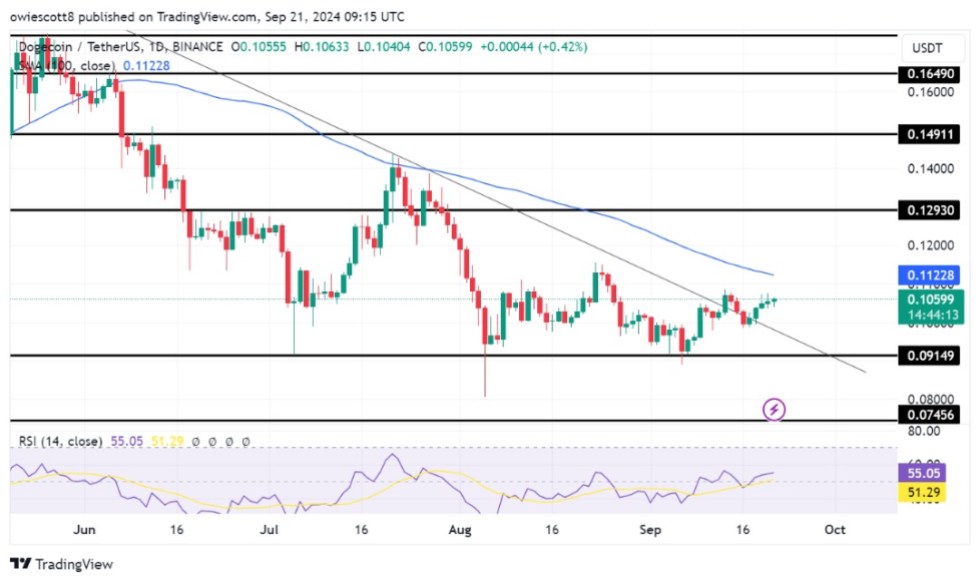
Dogecoin is once again in the spotlight as a recent change in its Relative Strength Index (RSI) brings a sense of excitement about potential price increases. The RSI, an important market indicator, hints at a possible bullish turnaround, suggesting that buying activity may be increasing. This positions Dogecoin for potential gains, aiming for a significant target of $0.1293. With market sentiment swinging in favor of buyers, many are left wondering if this is the time DOGE will reach new heights.
This article will delve into the recent changes in Dogecoin’s RSI and what they could mean for its price progression. By examining the technical aspects and market feelings surrounding this development, we will analyze the chances of DOGE hitting the $0.1293 target.

Currently, DOGE is trading around $0.1055, representing a small decline of 0.86% within the last day. The market capitalization for this cryptocurrency stands at approximately $15.4 billion, with a trading volume exceeding $503 million—both showing slight declines of 0.08% and 23.74%, respectively.
Technical Analysis: Indicators Pointing to Upward Trends
After a recent downturn, DOGE’s price is looking to rebound on the 4-hour chart, with the aim of reaching the $0.1293 target. DOGE is currently trading above the 100-day Simple Moving Average (SMA), which indicates a bullish upward trend.
The 4-hour RSI analysis shows potential for more upward movement, as it has climbed back to 59% after attempting to fall below the 50% mark. This indicates that bullish momentum is strengthening.
This strength shows that buyers are willing to support the price, creating a conducive environment for potential gains. As long as the RSI stays above this critical level, the chance for further upward movement remains bright.
On the daily chart, DOGE displays a positive trend, highlighted by multiple bullish candlesticks. Although it is currently trading below the 100-day SMA, the upward movement signals that bulls may be in charge, with the potential to push the price higher, aiming to break the 100-day SMA and hit the target of $0.1293.

Finally, on the 1-day chart, examining the RSI formation reveals that DOGE may continue its upward trajectory, as the RSI signal line has crossed above the 50% threshold, currently resting at 54%. This suggests a maintained positive market outlook.
Resistance Levels: Aiming for $0.1293 and Beyond
As Dogecoin continues to show bullish momentum, the next critical level to monitor is the $0.1293 mark. Should the meme coin manage to break past this level, the next resistance could be around $0.1491, potentially lifting market sentiment even higher and leading to increased price levels.
Conversely, if Dogecoin faces substantial resistance at $0.1293, it may start to decline towards the support level of $0.09149. If it breaks below this point, it could signal a further downward trend, possibly targeting the support range around $0.07456 or lower.


