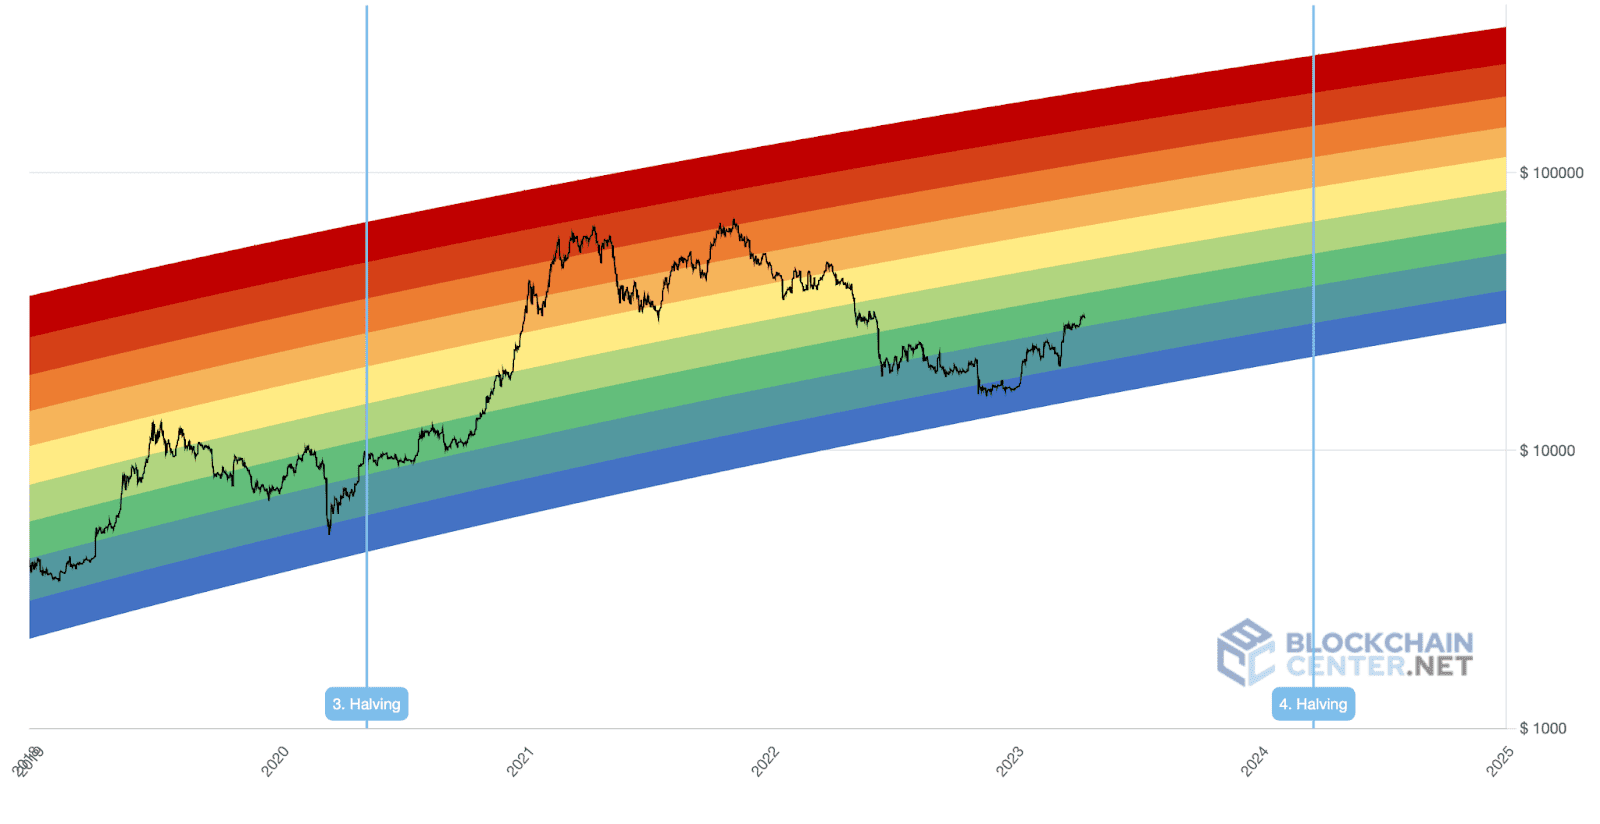
The Bitcoin Rainbow Chart is a well-known and eye-catching visual tool that many cryptocurrency enthusiasts and investors use to examine Bitcoin’s price trends over time. Although it lacks scientific validation for predicting future prices, it provides intriguing insights into Bitcoin’s past price patterns and possible future movements. This article will delve into the essence of the Bitcoin Rainbow Chart, its functionality, and its relevance in the crypto world.
What is the Bitcoin Rainbow Chart?
The Bitcoin Rainbow Chart is a logarithmic graph that illustrates Bitcoin’s price history with a series of colored bands that look like a rainbow. Each band signifies a different market sentiment or suggested action based on Bitcoin’s current price level.

Main Attributes of the Bitcoin Rainbow Chart:
- Logarithmic Visualization: The y-axis employs a logarithmic scale, enhancing the depiction of Bitcoin’s exponential price growth over time.
- Color-Coded Bands: Typically, the chart includes 9 or 10 colorful bands, each denoting a distinct market sentiment or price assessment.
- Time Representation: The x-axis indicates time, usually from Bitcoin’s inception around 2010 to the present day.
- Price Overlay: Bitcoin’s actual price history is projected onto these colored bands.
Meaning of the Color Bands
The colored bands from bottom to top reflect various sentiments:
- Dark Blue: “Essentially a Fire Sale” – Significantly undervalued
- Light Blue: “Buy!” – Undervalued
- Green: “Accumulate” – Cost-effective
- Yellow: “Still Cheap” – Fairly valued
- Orange: “Hold” – Getting expensive
- Red: “Is this a bubble?” – Overvalued
- Pink: “FOMO intensifies” – Highly overvalued
- Fuchsia: “Maximum Bubble Territory” – Extremely overvalued
The specific labels and the number of bands can vary depending on the chart version.
Interpreting the Bitcoin Rainbow Chart
The Rainbow Chart operates on these basic principles:
- When prices fall within the lower bands (blue and green), it may signal a good opportunity to buy or accumulate Bitcoin.
- When prices are in the middle bands (yellow and orange), it might suggest holding or exercising caution.
- When prices reach the upper bands (red and pink), it could indicate a bubble or overvaluation.
Historically, Bitcoin’s price has cycled through these bands, though past trends do not ensure future outcomes.
The Chart’s Origins
Über Holger, a Bitcoin aficionado and blockchain engineer, created the Bitcoin Rainbow Chart in 2014. Its design was inspired by the Bitcoin price charts from Azop on Reddit, which employed color-coded bands to depict various stages of Bitcoin’s price history.
Limitations and Critiques
Despite its popularity, the Bitcoin Rainbow Chart has its limitations:
- Lacks Scientific Basis: The chart is not grounded in strict financial or economic methodologies.
- Relies on Historical Data: Like many prediction tools, it heavily depends on past performance, which may not forecast future outcomes.
- Subjective Band Boundaries: The delineations between color bands are somewhat arbitrary and can change over time.
- Excludes Critical Factors: It doesn’t factor in external influences like regulatory changes, technology progress, or global economic conditions.
Using the Rainbow Chart within a Larger Framework
The Bitcoin Rainbow Chart is one among many instruments employed by cryptocurrency traders and analysts. It’s often utilized alongside other technical analysis tools, fundamental analysis, and indicators of market sentiment to create a more rounded perspective of the market.
Final Thoughts
The Bitcoin Rainbow Chart presents an engaging and straightforward method to visualize Bitcoin’s historical prices and potential future trends. However, it should not be the only basis for investment decisions, as many people in the crypto community find it a helpful resource for understanding Bitcoin’s long-term pricing patterns.
As with any investment approach or tool, it’s essential to merge the insights from the Rainbow Chart with diligent research, a robust comprehension of the cryptocurrency landscape, and mindful evaluation of your financial situation and risk appetite. Keep in mind that the cryptocurrency market is highly volatile and unpredictable, and no single tool can ensure success in investments.


